
Email Deliverability Benchmarks in 2026: Are You Above or Below Average?
Where does your email program actually stand? Compare your bounce rate, inbox placement, spam complaint rate, and sender reputation against the latest 2026 benchmarks — and learn exactly what to do if you're below average.
Most email marketers track their open rates and click rates religiously. Far fewer track the metrics that actually determine whether their email program is sustainable — inbox placement rate, bounce rate trend, spam complaint rate, and domain reputation score.
The result is a common and costly blind spot: teams that believe their email program is performing well because open rates look acceptable, while underlying deliverability metrics are quietly deteriorating. By the time open rates start to visibly decline, the reputation damage is already weeks or months old.
This guide gives you the complete 2026 benchmark picture across every metric that actually governs email deliverability — what the numbers look like for healthy senders, where the warning thresholds are, how to measure your own performance against these benchmarks, and what to do when you find yourself below average on any of them.
21% of permission-based marketing emails fail to reach the inbox in 2026 — meaning more than 1 in 5 campaigns are underperforming before content or offer quality is even considered
📷 2026 email deliverability benchmark dashboard: key metrics, thresholds, and industry averages at a glance
Why 2026 Benchmarks Are Different From Previous Years
Email deliverability standards have tightened materially over the past two years. Several specific changes have raised the bar for what "acceptable" performance looks like:
Google and Yahoo bulk sender requirements (February 2024, enforced through 2026): All senders sending more than 5,000 emails per day to Gmail or Yahoo addresses must have SPF, DKIM, and DMARC configured. Google has also established a hard spam complaint rate threshold of 0.08% — above which delivery rates begin to decline — and 0.3% at which deliverability collapses. One-click unsubscribe is also required for bulk senders.
Apple Mail Privacy Protection: Apple's Mail Privacy Protection masks open tracking for Apple Mail users, inflating open rate metrics for senders with significant iOS audiences. Open rate benchmarks in 2026 are less reliable than in previous years for this reason — segments with high Apple Mail usage show inflated open rates regardless of actual engagement.
Gmail's AI-powered filtering: Gmail's filtering has become significantly more sophisticated at distinguishing between wanted and unwanted email based on recipient behavior signals — not just content. Engagement-based reputation has become a more dominant factor in inbox placement than at any previous point.
These changes mean that benchmarks from 2022 or even 2023 are meaningfully outdated. The thresholds below reflect the current standard.
Benchmark 1: Inbox Placement Rate
Inbox placement rate is the percentage of sent emails that land in the recipient's primary inbox — as opposed to the spam folder, promotions tab, or other secondary location. It's the most direct measure of whether your email is actually being seen.
2026 benchmarks:
· 90%+ — Excellent. Your sender reputation is strong and your list quality is high.
· 85%–90% — Good. Healthy range for most established senders.
· 75%–85% — Below average. Something is limiting your inbox placement — investigate reputation, list quality, and authentication.
· Below 75% — Poor. More than 1 in 4 emails are missing the inbox. Deliverability intervention is required.
Industry average in 2026: approximately 79% — meaning a typical sender loses 21% of their emails to spam or filtering before engagement is even possible.
How to measure it: Inbox placement rate cannot be measured from your ESP dashboard alone (which shows delivery, not placement). Use tools like GlockApps, Litmus, or 250ok to test inbox placement across multiple providers. Run these tests before major campaigns.
Benchmark 2: Hard Bounce Rate
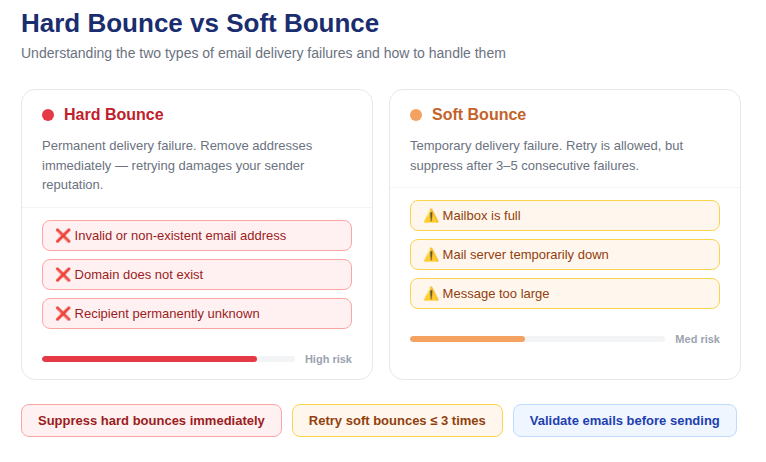
Hard bounce rate is the percentage of sent emails that permanently fail to deliver — because the address doesn't exist, the domain is dead, or the receiving server has permanently rejected your sending domain. Hard bounces are the most damaging signal for sender reputation.
2026 benchmarks:
· Below 0.5% — Excellent. Your list hygiene is consistently maintained.
· 0.5%–2% — Acceptable. Monitor closely and schedule list cleaning.
· 2%–5% — Warning zone. List cleaning is overdue. Run bulk email validation before your next send.
· Above 5% — Dangerous. Sender reputation is actively degrading. Stop sending until you've cleaned your list.
· Above 10% — Critical. ESP account suspension is imminent. Emergency list cleaning required.
Industry average in 2026: approximately 1.2% across all senders. Top-performing senders maintain below 0.3%.
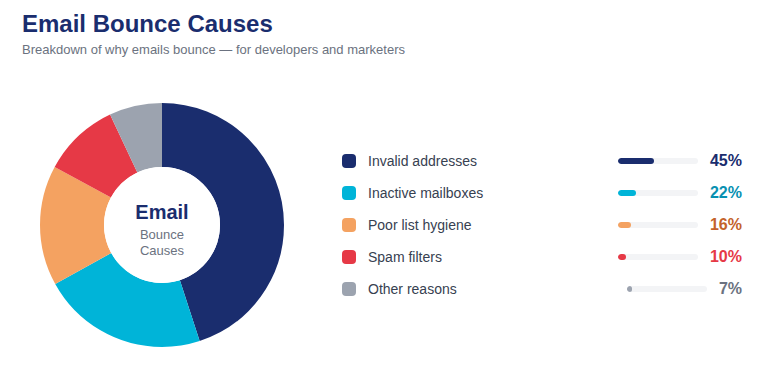
Primary driver: List decay. Email addresses go invalid at 22–25% per year. A list that hasn't been verified with bulk email validation in 12+ months will reflect this decay in its hard bounce rate on the next major send.
📷 Hard bounce rate trend over time: what happens without list cleaning vs. with regular bulk email validation
Benchmark 3: Spam Complaint Rate
Spam complaint rate is the percentage of recipients who click "Mark as Spam" on your emails. It's the most direct negative reputation signal available to inbox providers and the one with the most immediate impact on deliverability.
2026 benchmarks (Google's published thresholds):
· Below 0.01% — Excellent. Your content and list match well.
· 0.01%–0.08% — Acceptable. Monitor to ensure no upward trend.
· Above 0.08% — Warning. Gmail delivery rates begin to decline above this threshold. Investigate list quality and content relevance immediately.
· Above 0.3% — Critical. Gmail deliverability collapses at this level. Immediate intervention required.
Industry average in 2026: approximately 0.05% for senders with good list hygiene practices. Many senders exceed this without realizing it because complaint data is only visible through Google Postmaster Tools — not in most ESP dashboards.
Primary drivers: Sending to unengaged subscribers who don't remember subscribing, including disposable and role-based addresses that generate complaints from people who never opted in, sending too frequently for subscriber expectations, and making unsubscribing difficult.
Benchmark 4: Soft Bounce Rate
Soft bounces are temporary delivery failures — full mailboxes, temporarily unavailable servers, message size limits. Unlike hard bounces, they don't necessarily indicate a list quality problem, but they should be monitored and managed.
2026 benchmarks:
· Below 1% — Normal. Soft bounces at this level reflect transient server conditions.
· 1%–3% — Elevated. Some of your soft bounces may be repeat failures on the same addresses. Check whether addresses are soft-bouncing consistently across multiple sends.
· Above 3% — Investigate. High soft bounce rates can indicate infrastructure problems at the receiving end or addresses that should be reclassified as hard bounces after repeated failures.
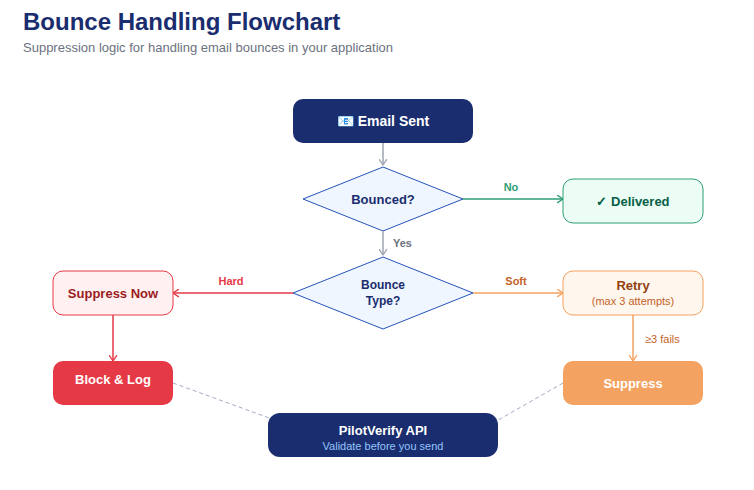
Management rule: Any address that soft-bounces on 3 or more consecutive sends should be treated as a hard bounce and suppressed.
Benchmark 5: Email Open Rate
Open rate is the most widely tracked email metric and — in 2026 — one of the least reliable, due to Apple Mail Privacy Protection inflating opens for iOS-heavy audiences. Use open rate as a trend indicator rather than an absolute benchmark, and segment by device/client when possible.
2026 benchmarks by industry (adjusted for MPP inflation):
· B2B / SaaS: 25%–40% (MPP-adjusted: 18%–30%)
· E-commerce / retail: 20%–30% (MPP-adjusted: 14%–22%)
· Media / publishing: 22%–35% (MPP-adjusted: 16%–26%)
· Nonprofit: 28%–40% (MPP-adjusted: 20%–30%)
· Financial services: 22%–32% (MPP-adjusted: 16%–24%)
What declining open rates actually mean: A consistent downward trend in open rate — particularly if not explained by MPP changes — is typically a deliverability signal. Emails going to spam don't generate opens. If your open rate has been declining over 3–6 sends without content changes, check your inbox placement rate and sender reputation before assuming the problem is your subject lines.
Benchmark 6: Click-Through Rate and Click-to-Open Rate
Click-through rate (CTR) measures clicks as a percentage of total sends. Click-to-open rate (CTOR) measures clicks as a percentage of opens — a cleaner signal of content engagement independent of deliverability.
2026 benchmarks:
· CTR: 2%–5% average across industries. Above 5% is strong; below 1.5% suggests content-audience mismatch.
· CTOR: 10%–20% is typical. Above 20% indicates strong content relevance. Below 8% suggests weak calls-to-action or poor content-audience fit.
CTOR is more useful than CTR for content optimization because it isolates the content experience from the deliverability/inbox placement question. If CTOR is strong but CTR is low, your deliverability is the likely constraint — more opens would yield more clicks if inbox placement improved.
Benchmark 7: Unsubscribe Rate
Unsubscribe rate measures the percentage of recipients who unsubscribe after each send. It's a signal of audience-content fit and frequency appropriateness — not inherently a deliverability metric, but correlated with list quality and engagement.
2026 benchmarks:
· Below 0.2% — Excellent. Strong audience fit and appropriate frequency.
· 0.2%–0.5% — Normal. Monitor for upward trends.
· 0.5%–1% — Elevated. Review content relevance and sending frequency.
· Above 1% — High. Significant audience-fit or frequency problem. Address before the next campaign.
Deliverability note: High unsubscribe rates are far less damaging to sender reputation than high spam complaint rates. If your unsubscribes are high, prioritize making the unsubscribe process easier — subscribers who can't unsubscribe easily will click "Mark as Spam" instead, which is far more damaging.
📷 2026 benchmark scorecard: all key metrics, industry averages, and healthy vs warning thresholds side by side
Benchmark 8: Sender Domain Reputation
Domain reputation is the ISP-level assessment of your sending domain's trustworthiness — distinct from IP reputation and more durable (both positively and negatively). It's the closest thing to a "credit score" for your email program.
Google Postmaster Tools reputation levels:
· High — Excellent. Your domain is trusted by Gmail. Expect strong inbox placement.
· Medium — Good. Normal healthy range. Some filtering may occur for borderline content.
· Low — Warning. Gmail is treating your domain with suspicion. Significant inbox placement degradation is likely occurring.
· Bad — Critical. Gmail may be routing most of your email directly to spam. Immediate intervention required.
How to check: Set up Google Postmaster Tools at postmaster.google.com for every sending domain you use. It's free, it takes 15 minutes to configure, and it's the most direct window into how Gmail perceives your domain.
What moves reputation from Low/Bad back to High/Medium: Consistent clean sending — low bounce rates, low complaint rates, strong engagement signals — over 4–12 weeks. There is no shortcut. List cleaning with bulk email validation is the first required step because it eliminates the primary source of reputation-damaging signals (hard bounces).
How to Measure Your Performance Against These Benchmarks
Your ESP provides some of this data directly. Other metrics require external tools. Here's where to find each benchmark for your own program:
· Hard bounce rate, soft bounce rate, unsubscribe rate: Available in your ESP's campaign reports.
· Open rate, CTR, CTOR: Available in your ESP's campaign reports. Remember to apply MPP adjustment for Apple Mail-heavy audiences.
· Spam complaint rate: Only reliably available through Google Postmaster Tools (for Gmail) and Microsoft SNDS (for Outlook). Not typically available in ESP dashboards.
· Inbox placement rate: Requires external testing via GlockApps, Litmus, or similar inbox placement testing tools. Not available in ESP dashboards.
· Domain reputation: Google Postmaster Tools for Gmail. Microsoft SNDS for Outlook. Sender Score (senderscore.org) provides a third-party view.
What to Do If You're Below Benchmark on Any Metric
Below Benchmark on Bounce Rate
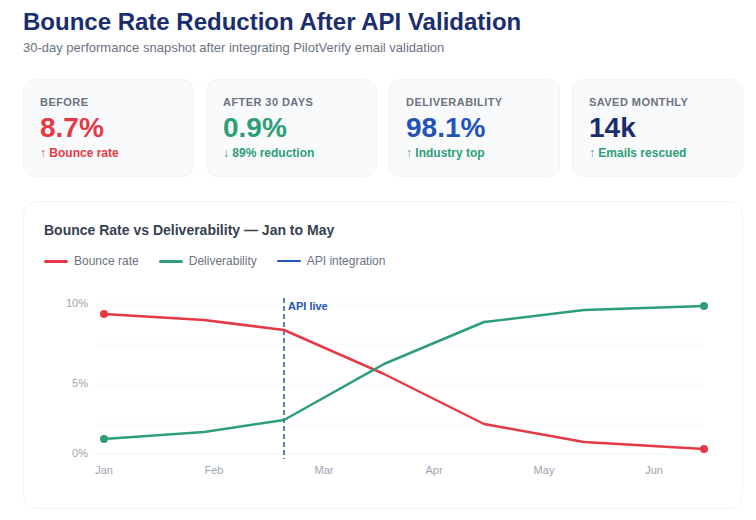
Run bulk email validation on your full active list immediately — before your next send. PilotVerify will identify and flag every invalid address for suppression. For senders at 5%+ bounce rate, this is a stop-everything action. The bounce rate improvement is immediate: your next send reflects the cleaned list.
Below Benchmark on Spam Complaint Rate
Review your most recent sends for: disposable and role-based addresses included in the send (flag these via bulk email validation), subscribers who haven't engaged in 12+ months (sunset this segment), sending frequency relative to expectations, and unsubscribe process friction. Address all four before your next send.
Below Benchmark on Inbox Placement
Run an inbox placement test via GlockApps to understand which providers are filtering your email and what reason they're giving. Check your domain reputation in Google Postmaster Tools. Verify authentication (SPF, DKIM, DMARC) is passing. Clean your list. Then send to your most engaged segment only for 2–3 sends to rebuild positive engagement signals before returning to full volume.
Below Benchmark on Open Rate (Without MPP Explanation)
If your open rate is declining and Apple MPP doesn't explain it, check inbox placement rate first — declining opens may reflect declining inbox placement, not declining interest. If inbox placement is stable, review subject line and preview text performance across recent sends, list engagement (are you including too many inactive subscribers?), and sending frequency.
Benchmark Tip: Don't benchmark against industry averages alone. Track your own metrics over time — your trend line is more informative than any single comparison to an industry number. A hard bounce rate of 1.5% that's stable is less concerning than one at 0.8% that's been rising for three months. The direction matters as much as the absolute number.
📷 Email deliverability monitoring dashboard: tracking all key benchmarks over time with trend indicators and threshold alerts
The Role of Email Validation in Hitting Benchmark
Of all the factors that determine whether you're above or below benchmark on the metrics that matter, list quality has the most direct and controllable impact. Hard bounce rate, spam complaint rate, inbox placement rate, and domain reputation are all directly improved by maintaining a clean, validated email list.
The relationship is causal, not correlational:
· Bulk email validation removes invalid addresses → hard bounce rate drops
· Lower bounce rate → sender reputation improves
· Better sender reputation → inbox placement rate improves
· Better inbox placement → more emails seen → higher open and click rates
· Removing disposable and role-based addresses → spam complaint rate drops
· Lower complaint rate → further reputation improvement
Every benchmark improvement in this guide starts from the same foundational step: maintaining a clean list through regular bulk email validation and real-time verification at every capture point.
Frequently Asked Questions (FAQ)
Q: How often should I check my deliverability benchmarks?
A: Review your ESP's campaign-level metrics (bounce rate, open rate, CTR) after every send. Check Google Postmaster Tools weekly. Run an inbox placement test via GlockApps or similar before every major campaign. Check your domain against blacklists (MXToolbox) after any bounce rate spike.
Q: My open rates look fine but my click rates are declining. What does that indicate?
A: Declining CTOR (click-to-open rate) with stable open rates typically indicates a content or offer relevance issue — people are opening but not finding enough value to click. If CTR is declining but CTOR is stable, the issue is likely inbox placement — fewer opens because fewer emails are reaching the inbox.
Q: Can I recover from a "Bad" domain reputation in Google Postmaster Tools?
A: Yes, but it requires patience. Clean your list completely (bulk email validation), suppress all inactive subscribers, fix any authentication issues, and then send only to your most engaged subscribers for 4–8 weeks at reduced volume. Gradually increase volume as reputation scores improve. The recovery timeline depends on how long the reputation was in Bad territory and how consistently clean your subsequent sends are.
Q: Are these benchmarks the same for transactional email vs. marketing email?
A: Transactional email (receipts, password resets, account notifications) typically sees better benchmark performance than marketing email — higher open rates, lower complaint rates, lower bounce rates — because recipients expect and want the emails. The same benchmark thresholds apply for bounce and complaint rates, but the bar for engagement is higher for transactional.
Q: How do I know if Apple MPP is affecting my open rate benchmark?
A: Segment your open rate data by email client or device. If a large proportion of your list uses Apple Mail on iOS or macOS, MPP will inflate your apparent open rate. Most ESPs now identify MPP-triggered opens separately. Look at your non-Apple open rate as a more reliable engagement indicator.
Q: What's the fastest way to improve multiple benchmark metrics simultaneously?
A: Running bulk email validation before your next send improves hard bounce rate, spam complaint rate (by removing disposable and role-based addresses), and indirectly improves inbox placement rate and sender reputation — all from a single action. It's the highest-leverage starting point for any deliverability improvement initiative.
Know Your Numbers. Then Improve Them.
Email deliverability is measurable. The benchmarks in this guide give you the reference points to know whether your program is healthy, declining, or already in crisis. The tools to measure your own performance exist and most are free. The path to improvement is systematic and well-understood.
The senders who consistently perform above benchmark are not doing anything mysterious. They maintain clean lists, authenticate properly, monitor reputation proactively, and respond to negative signals before they compound. That's the entire playbook.
PilotVerify gives you the list quality foundation that underpins above-benchmark performance: bulk email validation before every campaign, real-time verification at every capture point, 99.6% accuracy, and pay-as-you-go credits that never expire.
Try PilotVerify Free — Start measuring and improving your deliverability at pilotverify.net